Kinetic Screening of Nuclease Activity using Nucleic Acid Probes
Alien Balian*,1,2,3, Javier Garcia Gonzalez*,1,2,3, Nora Bastida1,3, Khadija-Tul Kubra Akhtar1,3, Baris A. Borsa1,2,3, Frank J. Hernandez1,2,3
1Department of Physics, Chemistry and Biology,Linköping University, 2Wallenberg Centre for Molecular Medicine (WCMM), 3Nucleic Acids Technologies Laboratory (NAT-lab),Linköping University
Altered nuclease activity has been associated with different human conditions, underlying its potential as a biomarker. The modular and easy to implement screening methodology presented in this paper allows the selection of specific nucleic acid probes for harnessing nuclease activity as a biomarker of disease.
Nucleases are a class of enzymes that break down nucleic acids by catalyzing the hydrolysis of the phosphodiester bonds that link the ribose sugars. Nucleases display a variety of vital physiological roles in prokaryotic and eukaryotic organisms, ranging from maintaining genome stability to providing protection against pathogens. Altered nuclease activity has been associated with several pathological conditions including bacterial infections and cancer. To this end, nuclease activity has shown great potential to be exploited as a specific biomarker. However, a robust and reproducible screening method based on this activity remains highly desirable.
Herein, we introduce a method that enables screening for nuclease activity using nucleic acid probes as substrates, with the scope of differentiating between pathological and healthy conditions. This method offers the possibility of designing new probe libraries, with increasing specificity, in an iterative manner. Thus, multiple rounds of screening are necessary to refine the probes’ design with enhanced features, taking advantage of the availability of chemically modified nucleic acids. The considerable potential of the proposed technology lies in its flexibility, high reproducibility, and versatility for the screening of nuclease activity associated with disease conditions. It is expected that this technology will allow the development of promising diagnostic tools with a great potential in the clinic.
Nucleases are a class of enzymes capable of cleaving the phosphodiester bonds that form the backbone structure of nucleic acid molecules. The vast diversity of nucleases makes their classification rather difficult. However, there are some common criteria used to describe nucleases, such as substrate preference (deoxyribonucleic acid (DNA) or ribonucleic acid (RNA)), cleavage site (endonucleases or exonucleases), or metal ion dependency, among others1. Nucleases are highly conserved catalytic enzymes that have fundamental roles in both, prokaryotic and eukaryotic organisms and have been used, and continue to be used, as gene editing tools2. They are also fundamental actors in DNA maintenance and replication, helping to keep genome stability and participating in proof-reading processes3. In bacteria, for example, nucleases have been identified as important virulence factors, able to promote bacterial survival by reducing the efficacy of the host’s immune system4,5,6,7,8. In mammals, nucleases have been suggested to be implicated in apoptosis9, mitochondrial biogenesis and maintenance10 and mediation of antibacterial and antiviral innate immune responses11. Not surprisingly, nuclease activity alterations, whether enhancement or lack of, have been implicated in a wide array of human diseases. These diseases range from a wide variety of cancers12,13 to cardiac hypertrophy10 or autoimmune diseases14. Therefore, nucleases have become interesting candidates as biomarkers for a heterogeneous group of human conditions. In fact, nucleases have already shown their potential as successful diagnostic tools for the detection of infections caused by specific bacterial agents, such as Staphylococcus aureus or Escherichia coli15,16. In many cancer types, expression of staphylococcal nuclease domain-containing protein 1 (SND1) ribonuclease is indicative of poor prognosis17. In pancreatic cancer patients, elevated ribonuclease I (RNase I) serum levels have been reported18 and proposed to be associated with cancerous cell phenotypes19. In ischemic heart conditions, such as myocardial infarction or unstable angina pectoris, deoxyribonuclease I (DNase I) serum levels have been shown to be a valid diagnostic marker20,21.
It has been hypothesized that the global blueprint of nuclease activity may be different in healthy and disease states. In fact, recent reports have used differences in nuclease activity to distinguish between healthy and cancerous phenotypes22 or to identify pathogenic bacterial infections in a species-specific manner15,23. These findings have opened a new avenue for the use of nucleases as biomarkers of disease. Therefore, there exists a necessity for the development of a comprehensive screening method able to systematically identify disease associated differences in nuclease activity, which may be of key importance in the development of new diagnostic tools.
Herein, we introduce and describe a new in vitro screening approach (Figure 1) to identify sensitive and specific probes capable of discriminating between nuclease activity in healthy and unhealthy, or activity specific to a type of cell or bacteria. Taking advantage of the modularity of nucleic acids, we designed an initial library of quenched fluorescent oligonucleotide probes consisting of a comprehensive set of different sequences and chemistries, both being important parameters for library design. These oligonucleotide probes are flanked by a fluorophore (fluorescein amidite, FAM) and a quencher (tide quencher 2, TQ2) at the 5′ and 3′ ends respectively (Table 1). By using this fluorescent resonance energy transfer (FRET) based fluorometric assay to measure the kinetics of enzymatic degradation, we were able to identify candidate probes with the potential to discriminate differential patterns of nuclease activity associated with healthy or disease states. We designed an iterative process, in which new libraries are created based on the best candidate probes, that allows the identification of ever more specific candidate probes in subsequent screening steps. Moreover, this approach takes advantage of the catalytic nature of nucleases to increase sensitivity. This is achieved by taking advantage of the activatable nature of the reporter probes and the ability of nucleases to continually process substrate molecules, both representing key advantages over alternative antibody or small molecule-based screening methods.
This approach offers a highly modular, flexible and easy to implement screening tool for the identification of specific nucleic acid probes capable of discriminating between healthy and disease states, and an excellent platform for the development of new diagnostic tools that can be adapted for future clinical applications. As such, this approach was used to identify the nuclease activity derived from Salmonella Typhimurium (herein referred to as Salmonella) for the specific identification of this bacteria. In the following protocol, we report on a method to screen for bacterial nuclease activity using kinetic analysis.
1. Oligonucleotide library design and preparation
- Library design
- Based on the following criteria design a library of quenched fluorescent oligonucleotide probes between 8 and 12-mer long to avoid secondary structure formation, with equal length for all probes.
- Include at least one DNA and one RNA random sequence containing a combination of adenine (A), guanine (G), cytosine (C) and thymine (T)/uracil (U) (DNA and RNA probes in Table 1).
NOTE: The DNA and RNA sequences described in Table 1 have been useful as the initial substrates for classifying an unknown type of nuclease activity, either DNase or RNase. These two sequences are recommended as the starting point for any screening, as they have shown a wide capability to detect nuclease activity profiles in bacteria and tissue samples. If nuclease activity is not observed with these DNA and RNA sequences, the design of additional oligonucleotides is required. - Include polynucleotide sequences consisting of a single type of nucleotide to determine sequence dependence for a given nuclease activity (DNA-Poly A, DNA-Poly T, DNA-Poly C, DNA-Poly G, RNA-Poly A, RNA-Poly U, RNA-Poly C and RNA-Poly G in Table 1).
- Using the same sequence of nucleotide residues as the initial DNA and RNA sequences, include sequences that contain nucleoside analogs harboring chemical modifications at the 2′-position of the ribose sugar, such as 2′-Fluoro and 2′-O-Methyl, as a stringent step for increasing the selectivity of the nucleases.
- Include fully modified sequences consisting entirely of 2′-Fluoro nucleoside analogs or 2′-O-Methyl nucleoside analogs (All 2′-F and All 2′-OMe, Table 1)
- Include chimeric sequences consisting of unmodified natural purines and 2′-Fluoro pyrimidine nucleoside analogs (RNA Pyr-2’F, Table 1).
- Include chimeric sequences consisting of unmodified natural purines and 2′-O-Methyl pyrimidine nucleoside analogs (RNA Pyr-2’OMe, Table 1).
- Include chimeric sequences consisting of unmodified natural pyrimidines and 2′-Fluoro purine nucleoside analogs (RNA Pur-2’F, Table 1).
- Include chimeric sequences consisting of unmodified natural pyrimidines and 2′-O-Methyl purine nucleoside analogs (RNA Pur-2’OMe, Table 1).
- Include at least one DNA and one RNA random sequence containing a combination of adenine (A), guanine (G), cytosine (C) and thymine (T)/uracil (U) (DNA and RNA probes in Table 1).
- Based on the following criteria design a library of quenched fluorescent oligonucleotide probes between 8 and 12-mer long to avoid secondary structure formation, with equal length for all probes.
- Oligonucleotide probe preparation and storage
NOTE: Oligonucleotides are synthesized by the phosphoramidite method. After synthesis, the oligonucleotides are purified using high performance liquid chromatography (HPLC) and the mass is measured by mass spectrometry.- Spin down the lyophilized oligonucleotide probes using a centrifuge and dilute them in Tris-EDTA (TE) buffer to prevent nuclease degradation. Determine the dilution volume according to the yield of each probe to render a stock solution with a concentration of 500 pmol/μL.
- Store lyophilized oligonucleotides at 4 °C or room temperature for a short term. For long term storage (months to years), store lyophilized oligonucleotides at -20 °C. Upon resuspension of lyophilized oligonucleotides in TE, store the stock solutions at -20 °C or, preferably, at -80 °C.
2. Bacterial culture
- Take one porous glass bead from the cryogenic storage vial under sterile conditions.
- To isolate individual bacterial colonies (Salmonella and E. coli), use the quadrant method24 by streaking/rolling the bead directly onto a Petri dish containing Tryptic Soy Agar (TSA) medium supplemented with defibrinated sheep blood.
- Incubate the culture at 37 °C for 24 h.
3. Supernatant preparation
- Transfer a single colony from solid media to 50 mL Tryptic Soy Broth (TSB) and incubate at 37 °C for 24 h at 200 rpm.
- Dilute the culture (1:500) in TSB (sub-culture) and incubate at 37 °C for 24 h at 200 rpm in a shaking incubator.
NOTE: It is expected that after 24 h of incubation the bacterial cultures are in stationary phase reaching values higher than 109 CFU/mL. - After the incubation period, transfer the cultures to capped sterile tubes and centrifuge at 4,500 x g for 30 min.
- Collect the supernatant and use it immediately. Alternatively, store the supernatants at 4 °C or -20 °C.
4. Nuclease Activity Assay
- Preparation of working solutions
- Prepare a 20 μL working solution for each probe in 1.5 mL nuclease free microcentrifuge tubes by diluting (1:10 ratio) the stock solution (500 pmol/μL) for a final working concentration of 50 pmol/ μL. For that purpose, mix 18 μL of Phosphate Buffer Saline (PBS) containing MgCl2 and CaCl2 with 2 μL of probe stock solution.
NOTE: Be aware that in the working solution, the oligonucleotides are more vulnerable to nuclease degradation, therefore, it is recommended to prepare the working solutions just before setting up the reaction. - Avoid direct light contact during the preparation and keep in the dark (wrapped in foil), when dealing with fluorophores.
- Prepare a 20 μL working solution for each probe in 1.5 mL nuclease free microcentrifuge tubes by diluting (1:10 ratio) the stock solution (500 pmol/μL) for a final working concentration of 50 pmol/ μL. For that purpose, mix 18 μL of Phosphate Buffer Saline (PBS) containing MgCl2 and CaCl2 with 2 μL of probe stock solution.
- Reaction set up
- Pre-warm the fluorometer (e.g. Cytation 1) to 37 °C.
- Prepare a set (one tube/probe) of 1.5 mL nuclease free microcentrifuge tubes for each sample (TSB, E. coli and Salmonella) and label accordingly.
- Carefully add 96 μL of TSB sterile culture media, Salmonella supernatant or E. coli supernatant (from the step 3.4.). Subsequently, add 4 μL/tube of probe working solution accordingly. Perform this step at room temperature.
NOTE: 10 probes were used for the first round of the screening and 6 probes for the second round. - Mix thoroughly by pipetting up and down to obtain a homogenous solution. Avoid introducing air bubbles into the samples while mixing.
- Load 95 μL of each solution (probe + supernatant or culture media) into a separate well of a black bottom, non-treated 96 well plate. Minimize the formation of bubbles in the wells upon loading by dispensing carefully with the tip close to the wall of the well.
- Cover the plate with its lid. Visually inspect the lid and check for pen markings or dust particle accumulation that may introduce measurement artifacts. Replace the lid for a new one if that is the case.
- Measurement set up
- Open the acquisition software (Gen5 3.05) by clicking the software shortcut icon (Figure S1A).
- Select Read Now from the task manager window and choose New… to create the kinetic measurement protocol (Figure S1B).
- Click on Set Temperature in the dialog window titled Procedure and select 37 ˚C. Confirm and save the settings by pressing OK (Figure S1C).
- Click on Start Kinetics in the dialog window titled Procedure. Then in the pop-up dialog window, titled Kinetic Step, select 2 h in the Run Time input box and 2 min in the Interval input box. Confirm and save the settings by pressing OK (Figure S1D).
- Click on Read in the dialog window titled Procedure. Then in the pop-up dialog window, titled Read Method, select Fluorescence Intensity as a detection method, Endpoint/Kinetic as a read type and Filters as optics type. Confirm and save the settings by pressing OK (Figure S1E).
- In the pop-up dialog window titled Read Step (Kinetic), select Green from the Filter Set. Confirm and save the settings by pressing OK (Figure S2A).
- In the dialog window titled Procedure, select use lid and click on validate to ensure that the created protocol is valid. This is confirmed by a pop-up dialog window (Figure S2B).
- Select protocol in the menu bar and choose procedure (Figure S2C).
- In the dialog window titled Procedure, define the wells to be measured (Figure S2D).
- Enter the name of the experiment in the file name input box (Figure S2E).
- Load the plate with its lid into the plate reader. Ensure the plate is in the right orientation.
- Start the acquisition by clicking read new button in the toolbar (Figure S2F).
- Data Analysis
- Click on one of the measured wells in the dialog window titled Plate 1 (Figure S3A).
- Click select wells and include all the measured wells in the well selection dialog window. Confirm and save the settings by pressing OK. (Figure S3B).
- Select data in the dialog window titled Plate 1 to visualize the tabulated results (Figure S3C).
- Export the data to a spread sheet by selecting quick export from the context menu (Figure S3C).
- In the spread sheet, label the data columns accordingly for each sample and probe.
- Generate kinetic graphs, using line with markers style, by plotting relative fluorescence units (RFU) versus time (x-axis: timeline of the reaction and y-axis: RFUs).
NOTE: The description of generating a graph is applicable when using spreadsheet programs (e.g., Excel). However, any other programs can be used to generate graphs from the raw data obtained, by plotting RFU versus time. - Calculate the rate of the enzymatic reaction for each measured interval according to the following formula25: rate=
 , where If is RFU at the maximal interval time point and Ii is RFU at the minimal interval time point, and Tf and Ti are the maximal and minimal interval time points, respectively.
 - Select the rate with the highest value (Rmax) for each curve. If there is more than one Rmax per sample, select the one that occurs at the earliest measurement time point.
- Calculate the ratio between Rmax and the average value of the time interval at which Rmax occurs: rate coefficient =

- Calculate the fold difference (FD) between the rate coefficient of Salmonella and E. coli for each probe.
- Consider a fold difference value higher than 3 as significant.
- Consider the significant probes with the highest fold difference values (FD) as candidate probes and as the basis for the library design in the next screening round.
5. Screening Rounds’ Selection Criteria (Figure 1)
- First Round of Screening
- Perform the nuclease activity assay (as described in section 4) using DNA, RNA and polynucleotide probes.
- Evaluate the preference for DNA chemistry or RNA chemistry by comparing the number and performance (FD value) of DNA and RNA candidate probes.
- Select the type of nucleic acid chemistry rendering the greatest number of candidate probes, as illustrated in Figure 1.
- Second Round of Screening
- Perform the nuclease activity assay (as described in section 4) using fully modified probes and chimeric probes designed based on the nucleic acid substrate selected in the first screening round.
- Evaluate the preference towards sequences containing 2′-Fluoro and 2′-O-Methyl nucleoside analogs by comparing the results obtained for 2′-Fluoro and 2′-O-Methyl modified candidate probes.
- Select the type of nucleoside analog modification rendering the greatest number of candidate probes, as illustrated in Figure 1.
Figure 1 shows the work flow of this methodology, which is divided into two screening rounds. In the first round of screening, we used 5 DNA probes (DNA, DNA Poly A, DNA Poly T, DNA Poly C and DNA Poly G) and also 5 RNA probes (RNA, RNA Poly A, RNA Poly U RNA Poly C and RNA Poly G). The raw data of this screening round can be found in Supplementary Table 1. In the second round, chemically modified probes were synthesized by replacing the RNA sequence with chemically modified nucleosides (All 2′-Fluoro and All 2′-OMethyl) or by the combination of RNA and purines or pyrimidines chemically modified (RNA Pyr-2’F, RNA Pyr-2’OMe, RNA Pur-2’F and RNA Pur-2’OMe). The raw data of this screening round can be found in Supplementary Table 2. A detailed description of the sequences can be found in Table 1. The results obtained from the first screening round are shown in Figure 2, where Salmonella culture supernatants report a clear preference for RNA probes over DNA probes. In contrast, E. coli and culture media controls show very limited capability to degrade RNA probes. In addition, we have calculated the fold difference (FD) between the rate coefficients of Salmonella and E.coli (Supplementary Table 3 and Supplementary Table 4) in order to identify the best performing probes. The calculations were performed as described in the protocol section.
These results suggest the presence of an RNase type of activity derived from Salmonella. Based on the identification of RNA as the preferred nucleic acid type for Salmonella nucleases, we have designed a new library using chemically modified nucleotides to be used in the second round of screening aimed at increasing the specificity of the probes. Figure 3 shows the kinetic profiles of the probes containing chemically modified nucleotides. Interestingly, RNA Pyr-2’OMe and RNA Pur-2’OMe show the best performing kinetic behavior when compared with RNA Pyr-2’F and RNA Pur-2’F, respectively.
These results suggest that Salmonella has an important RNase activity that can be used for selecting probes capable of specifically recognizing this bacteria. Moreover, we observed that 2′-OMe chemically modified nucleosides are more suitable for the type of RNAses secreted by Salmonella. With this in mind, the protocol described in this contribution offers the possibility of exploring the use of nuclease activity as a biomarker.
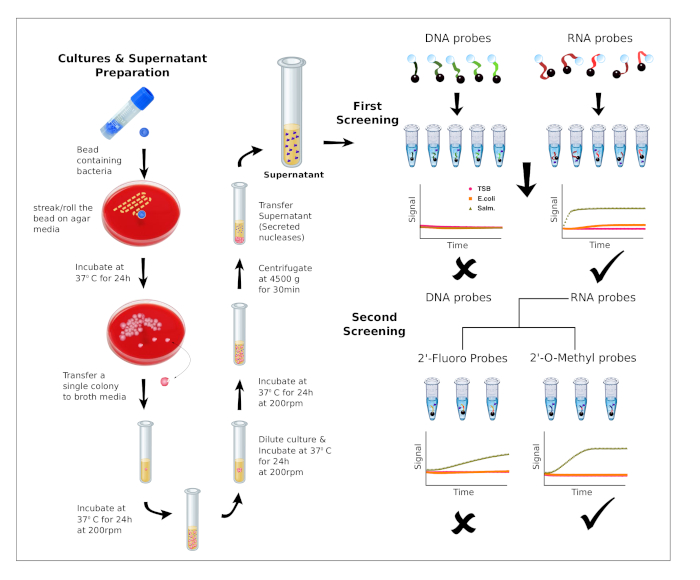
Figure 1: Bacteria cultures and workflow of the screening process. Preparation of bacteria cultures and supernatants (left). Description of the workflow for the two screening rounds. First screening: The preference for DNA or RNA is evaluated using 10 probes. Second screening: Based on nucleic acid preference, additional probes containing chemically modified nucleotides are evaluated to identify the best performing substrates for a given nuclease activity. Please click here to view a larger version of this figure.
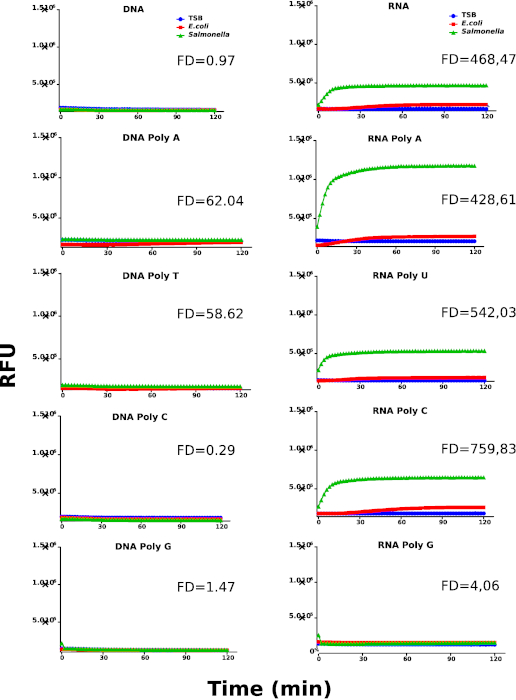
Figure 2: First kinetic screening round. Kinetic profiles of Salmonella, E. coli and culture media (TSB) using DNA and RNA probes. Nuclease activity is represented by relative fluorescence units (RFU). The graphs are representative for at least 3 individually performed experiments. The different samples are labeled as indicated in the graph’s legend. Fold difference (FD) values were calculated using the rate coefficients of Salmonella and E. coli for each probe. Please click here to view a larger version of this figure.
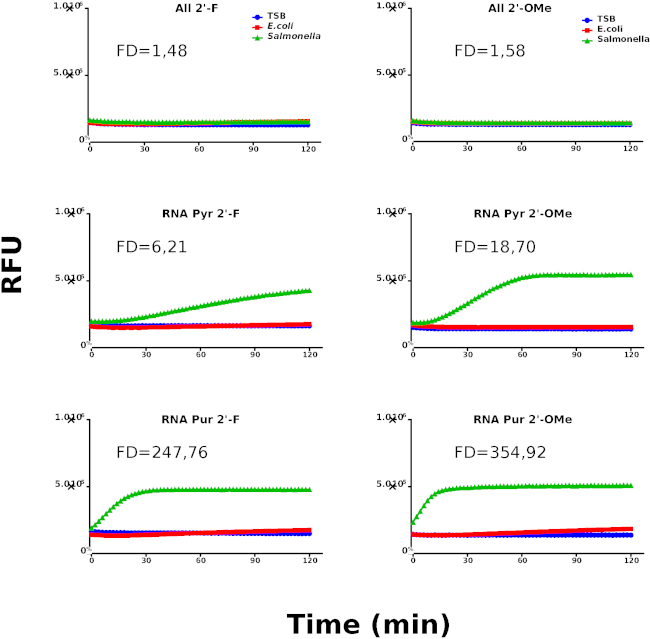
Figure 3: Second kinetic screening round. Kinetic profiles of Salmonella, E. coli and culture media (TSB) using chemically modified probes. Nuclease activity is represented by relative fluorescence units (RFU). The graphs are representative for at least 3 individually performed experiments. The different samples are labeled as indicated in the graph’s legend. Fold difference (FD) values were calculated using the rate coefficients of Salmonella and E.coli for each probe. Please click here to view a larger version of this figure.
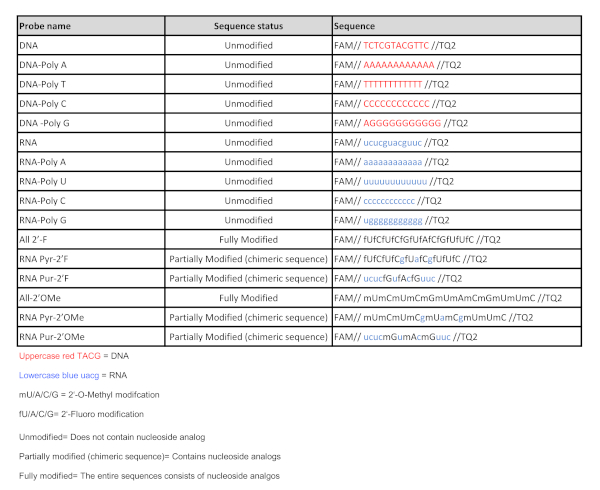
Table 1: Nucleic acid probe sequences. List of all the nucleic acid probes used in this study. Please click here to view a larger version of this figure.
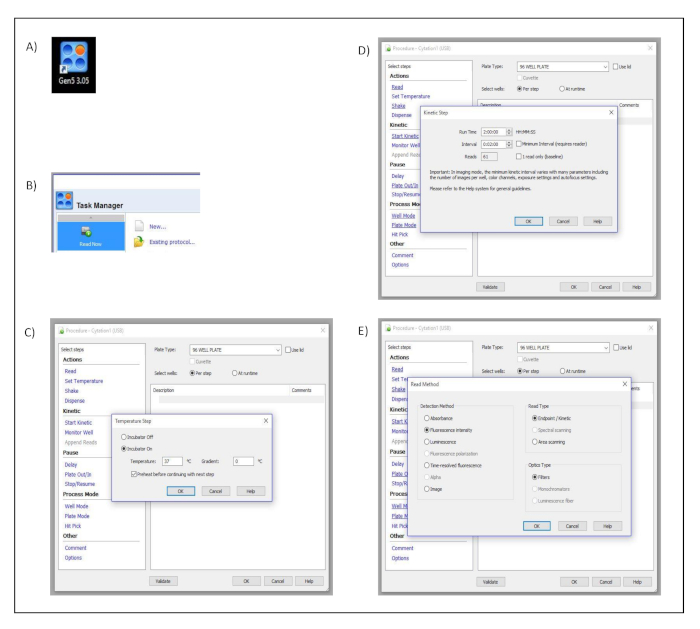
Supplementary Figure 1: Measurement set up. Button clicks and dialog windows describing the stepwise process performed in the acquisition software to set up the different measurement parameters. (A) Desktop icon. (B) Task manager dialog window. (C) Procedure and Temperature Set up dialog windows. (D) Procedure and Kinetic Step dialog windows. (E) Procedure and Read Method dialog windows. Please click here to view a larger version of this figure.
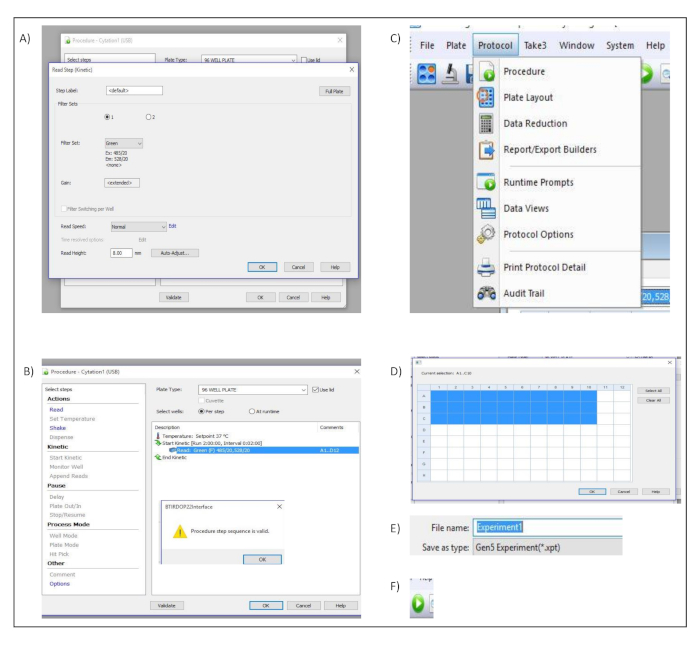
Supplementary Figure 2: Measurement set up. Button clicks and dialog windows describing the stepwise process performed in the acquisition software to set up the different measurement parameters. (A) Procedure and Read Step (Kinetic) Dialog windows. (B) Procedure dialog window (C) “Protocol” menu bar. (D) Well selection dialog window. (E) File name input box. (F) Run New icon used to start the acquisition within the software. Please click here to view a larger version of this figure.
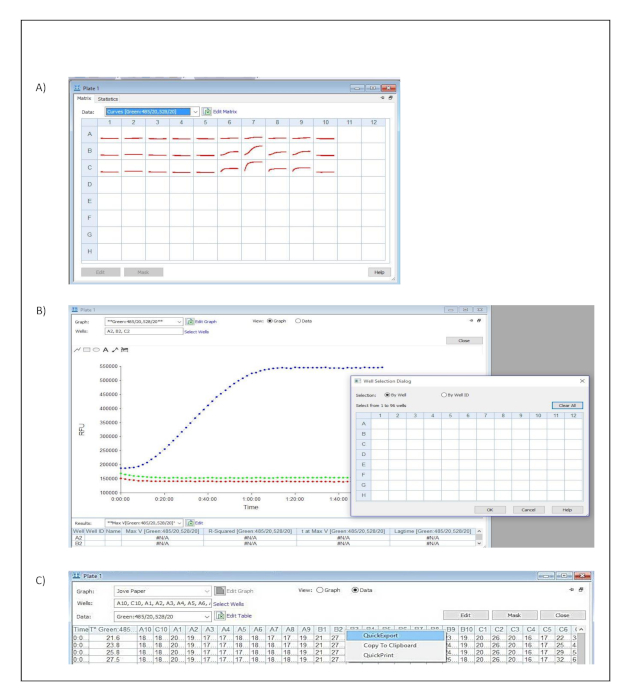
Supplementary Figure 3: Data analysis. Button clicks and dialog windows describing the stepwise process performed in the acquisition software to export acquired data into a spread sheet for further analysis. (A) Plate Matrix dialog window. (B) Plate and Well Selection dialog windows. (C) Plate dialog window and Quick Export context menu. Please click here to view a larger version of this figure.
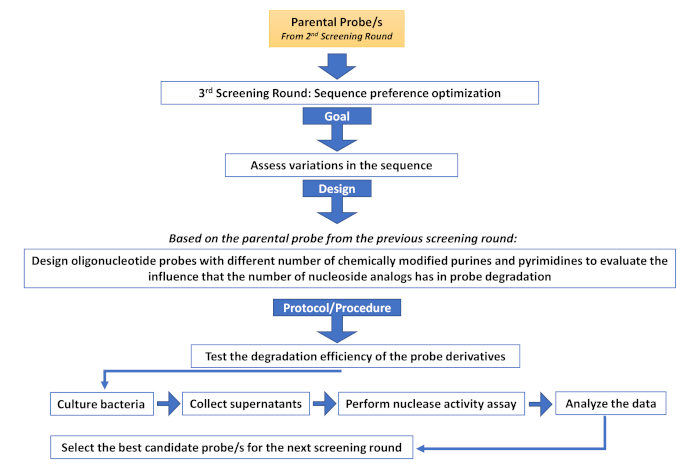
Supplementary Figure 4: Third screening round (Sequence preference optimization). Description of the different steps involved in an additional screening round aimed at assessing sequence variations. Please click here to view a larger version of this figure.
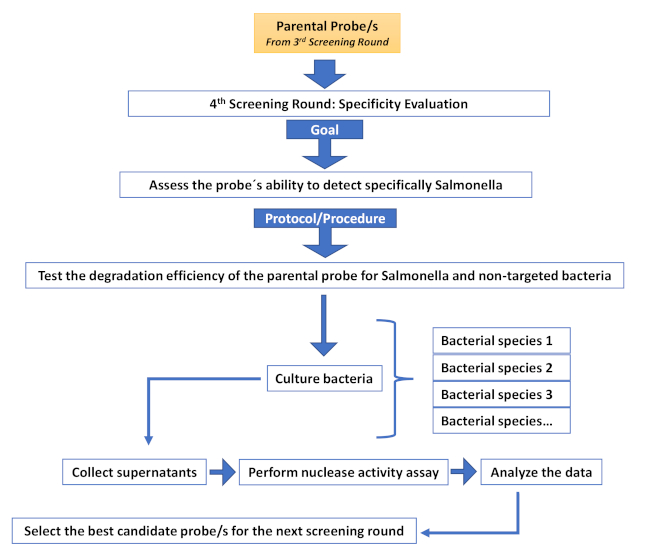
Supplementary Figure 5: Fourth screening round (Specificity evaluation round). Description of the different steps involved in an additional screening round aimed at increasing specificity. Please click here to view a larger version of this figure.
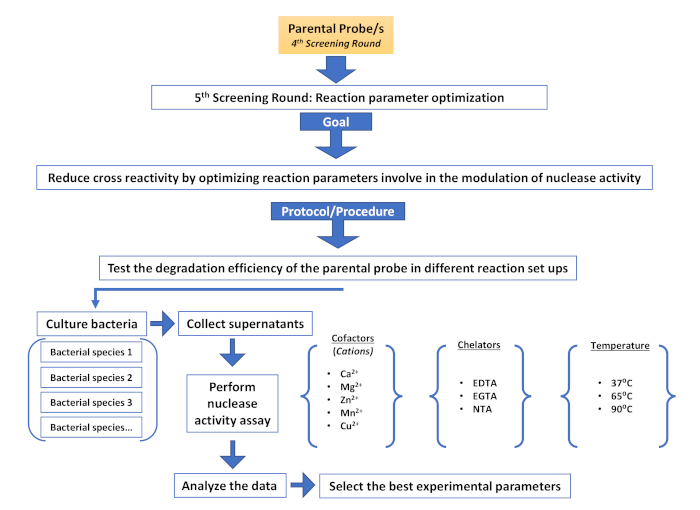
Supplementary Figure 6: Fifth screening round (Reaction parameter optimization). Description of the different steps involved in an additional screening round aimed at reducing non-target cross reactivity by modulating nuclease activity. Please click here to view a larger version of this figure.

Supplementary Table 1: Raw data from the first screening round. For each probe (labeled in red, on top), the acquisition time and the raw fluorescence values were reported for TSB, E. coli and Salmonella, along with the calculated rate value for each interval. The calculations were carried out as described in the methods section. Please click here to download this file.

Supplementary Table 2: Raw data from the second screening round. For each probe (labeled in red, on top), the acquisition time and the raw fluorescence values were reported for TSB, E. coli and Salmonella, along with the calculated rate value for each interval. The calculations were carried out as described in the methods section. Please click here to download this file.

Supplementary Table 3: Data analysis for the first screening round. For each probe (labeled in red, on top), the following values were obtained for TSB, E. coli and Salmonella: maximum rate values, minimal and maximal interval time points, rate coefficient, fold difference values between Salmonella and E. coli over TSB and fold difference values between Salmonella and E. coli (highlighted in yellow). The calculations were carried out as described in the methods section and the calculation formulas and the step by step calculations are shown in the spreadsheet. Please click here to download this file.

Supplementary Table 4: Data analysis for the second screening round. For each probe (labeled in red, on top), the following values were obtained for TSB, E. coli and Salmonella: maximum rate values, minimal and maximal interval time points, rate coefficient, fold difference values between Salmonella and E. coli over TSB and fold difference values between Salmonella and E. coli (highlighted in yellow). The calculations were carried out as described in the methods section and the calculation formulas and the step by step calculations are shown in the spreadsheet. Please click here to download this file.
Alterations of nuclease activity have been associated with a wide variety of disease phenotypes, including different types of cancer and bacterial infections. These alterations are proposed to be the causative agent of a condition14, while in other cases they are the consequence of a detrimental physiological event20 or pathogenic agent16,26. Not surprisingly, attempts to use nucleases and nuclease activity as a diagnostic biomarker have been described15,22,23,26, with considerable promise. Accordingly, the establishment of a robust and reproducible screening approach for the systematic evaluation of nuclease activity in disease and for the identification of specific and sensitive reporter seems pertinent. To address this necessity, we have developed a robust, modular and easy to implement screening platform based on a fluorescence assay, that allows the discovery of novel disease biomarkers and the identification of sensitive and specific nucleic acid probes in parallel, by using the catalytic action of nucleases.
Powerful screening tools such as small molecule high throughput screening (HTS)27, systematic evolution of ligands by exponential enrichment (SELEX)28 or phage display29 have been previously reported, which allow the identification of high affinity recognition molecules (e.g., small molecules, aptamers or binding-peptides). In comparison, the screening approach presented here allows the selection of probes that can identify known and unknown nuclease activity. Furthermore, this approach is compatible with in vitro, ex vivo and in vivo screening models. Moreover, the reactive nature of nucleases confers an obvious advantage over the aforementioned approaches, in that the probe-nuclease interaction is not a static, but a dynamic process. This means that the nucleases’ activity becomes an intrinsic signal amplification module for the reporter probes since several reporter probes can interact with a single nuclease.
As in any other screening method, the generation and management of the initial library is essential. The nature of nucleic acid probes provides great flexibility in the design and creation of a library and allows the introduction of varying degrees of complexity depending on the screening application. Library complexity can be introduced at different levels including sequence motifs, nucleotide chemistry, phosphate backbone chemistry, and oligonucleotide length. Modulating the complexity of the library allows to identify probes, not only for their capacity to successfully identify nuclease activity associated with disease but also for properties compatible with subsequent in vivo applications. Furthermore, a nucleic acid base library offers several advantages over its antibody or peptide counterparts. On the one hand, antibody production is well known to be cumbersome, requiring animals or complex eukaryotic culture systems, which increase the cost and introduce batch variability30,31. Moreover, the high molecular weight and immunogenicity limit their application28,32. On the other hand, the generation of biological peptide libraries usually requires either viral or bacterial expression systems29,30, increasing the complexity of the screening process. Chemical peptide libraries avoid this problem, at the expense of using convoluted bead-based systems or multiple rounds of expensive peptide synthesis33. All these problems are circumvented by using a nucleic acid library. Once the initial library has been established, the screening methods are quick and straightforward. The method described herein serves as a platform for additional screening rounds, such as, sequence optimization (Supplementary Figure 4), specificity evaluation (Supplementary Figure 5) or optimization of modulatory elements of nuclease activity, such as metal cofactors (typically divalent cations) and chelators, which are very useful to increase the specificity of the selected probes (Supplementary Figure 6).
The kinetic fluorometric assay used in this study can be optimized for both, bacterial and cellular cultures, with the screening being performed in user-friendly microtiter plates. In the case of cellular assays, this protocol is compatible with both, suspension and monolayer cultures, which, post-optimization, can be used according to the necessities of the in vitro model being studied. We have identified several critical steps that require optimization prior to screening. These include the cell number or bacterial density to be assayed, probe concentration, fluorometer detector gain settings or the implementation of in-built background correction methods. One limitation of this technology is the need for an altered nuclease activity associated with the pathological condition of interest. Without this feature, the screening approach for the selection of candidate probes is not feasible. Another limitation is the self-quenching ability of guanines when they are in close proximity to the fluorophore. This characteristic needs to be considered when designing the library.
The enzymatic nature of the reaction being measured makes it necessary to consider plate loading times. Minimizing loading times will reduce background differences between different experimental conditions. Several options exist to overcome this problem, such as slowing the enzymatic reaction during loading by using ice-cold reagents, or using automated loading systems, though the latter increases costs considerably, but also the throughput. Moreover, kinetic measurements are a great improvement over static measurements, providing a complete and more realistic picture of the dynamics of nucleases’ catalytic activity.
In summary, our protocol offers a versatile, robust and reproducible screening method for the identification of sensitive and specific nucleic acid probes for the detection of nuclease activity associated with the disease, which overcomes major hurdles of alternative screening methods. We anticipate that this screening technology will allow the development of novel diagnostic tools in a multitude of conditions, with easy translatability to the clinic.
The authors have nothing to disclose.
The authors would like to acknowledge Luiza I. Hernandez (Linköping University) for her careful revision of the manuscript and valuable advice. This work was supported by The Knut and Alice Wallenberg Foundation and The Swedish Government Strategic Research Area in Materials Science on Advanced Functional Materials at Linköping University (Faculty Grant SFO-Mat-LiU No. 2009-00971).
| Black bottom, non-treated 96 well plate | Fisher Scientific | 10000631 | |
| Cytation1 | BioTek | CYT1FAV | |
| Eppendorf tubes | Thermofisher | 11926955 | |
| Escherichia coli | ATCC | 25922 | |
| Microbank cryogenic storage vial containing beads | Pro-Lab Diagnostics | 22-286-155 | |
| Nucleic acid probes | Biomers.net | # | |
| Phosphate Buffer Saline containing MgCl2 and CaCl2 | Gibco™ | 14040117 | |
| Salmonella enterica subs. Enterica | ATCC | 14028 | |
| Tris-EDTA | Fisher Scientific | 10647633 | |
| Tryptone Soya Agar with defibrinated sheep blood | Thermo Fisher Scientific | 10362223 | |
| Tryptic Soy Broth | Sigma Aldrich | 22092 |
- Yang, W. Nucleases: diversity of structure, function and mechanism. Quarterly Reviews of Biophysics. 44 (1), 1-93, (2011).
- Adli, M. The CRISPR tool kit for genome editing and beyond. Nature Communication. 9 (1), 1911, (2018).
- Mason, P. A., Cox, L. S. The role of DNA exonucleases in protecting genome stability and their impact on ageing. Age (Dordr). 34 (6), 1317-1340, (2012).
- Berends, E. T. et al. Nuclease expression by Staphylococcus aureus facilitates escape from neutrophil extracellular traps. Journal of Innate Immunity. 2 (6), 576-586, (2010).
- Kiedrowski, M. R. et al. Staphylococcus aureus Nuc2 is a functional, surface-attached extracellular nuclease. PLoS One. 9 (4), e95574, (2014).
- Morita, C. et al. Cell wall-anchored nuclease of Streptococcus sanguinis contributes to escape from neutrophil extracellular trap-mediated bacteriocidal activity. PLoS One. 9 (8), e103125, (2014).
- Hasegawa, T. et al. Characterization of a virulence-associated and cell-wall-located DNase of Streptococcus pyogenes. Microbiology. 156 (Pt 1), 184-190, (2010).
- Moon, A. F. et al. Structural insights into catalytic and substrate binding mechanisms of the strategic EndA nuclease from Streptococcus pneumoniae. Nucleic Acids Research. 39 (7), 2943-2953, (2011).
- Li, L. Y., Luo, X., Wang, X. Endonuclease G is an apoptotic DNase when released from mitochondria. Nature. 412 (6842), 95-99, (2001).
- McDermott-Roe, C. et al. Endonuclease G is a novel determinant of cardiac hypertrophy and mitochondrial function. Nature. 478 (7367), 114-118, (2011).
- Wang, Y. T. et al. A link between adipogenesis and innate immunity: RNase-L promotes 3T3-L1 adipogenesis by destabilizing Pref-1 mRNA. Cell Death & Disease. 7 (11), e2458, (2016).
- Li, C. L., Yang, W. Z., Shi, Z., Yuan, H. S. Tudor staphylococcal nuclease is a structure-specific ribonuclease that degrades RNA at unstructured regions during microRNA decay. RNA. 24 (5), 739-748, (2018).
- Wan, L. et al. MTDH-SND1 interaction is crucial for expansion and activity of tumor-initiating cells in diverse oncogene- and carcinogen-induced mammary tumors. Cancer Cell. 26 (1), 92-105, (2014).
- Keyel, P. A. Dnases in health and disease. Developmental Biology. 429 (1), 1-11, (2017).
- Hernandez, F. J. et al. Noninvasive imaging of Staphylococcus aureus infections with a nuclease-activated probe. Nature Medicine. 20 (3), 301-306, (2014).
- Flenker, K. S. et al. Rapid Detection of Urinary Tract Infections via Bacterial Nuclease Activity. Molecular Therapy. 25 (6), 1353-1362, (2017).
- Kannan, N., Eaves, C. J. Tipping the balance: MTDH-SND1 curbs oncogene-induced apoptosis and promotes tumorigenesis. Cell Stem Cell. 15 (2), 118-120, (2014).
- Kemmer, T. P., Malfertheiner, P., Buchler, M., Kemmer, M. L., Ditschuneit, H. Serum ribonuclease activity in the diagnosis of pancreatic disease. International Journal of Pancreatology. 8 (1), 23-33 (1991).
- Fernandez-Salas, E., Peracaula, R., Frazier, M. L., de Llorens, R. Ribonucleases expressed by human pancreatic adenocarcinoma cell lines. European Journal of Biochemistry. 267 (5), 1484-1494 (2000).
- Fujibayashi, K. et al. Serum deoxyribonuclease I activity can be a useful diagnostic marker for the early diagnosis of unstable angina pectoris or non-ST-segment elevation myocardial infarction. Journal of Cardiology. 59 (3), 258-265, (2012).
- Kawai, Y. et al. Diagnostic use of serum deoxyribonuclease I activity as a novel early-phase marker in acute myocardial infarction. Circulation. 109 (20), 2398-2400, (2004).
- Hernandez, L. I., Ozalp, V. C., Hernandez, F. J. Nuclease activity as a specific biomarker for breast cancer. Chemical Communication (Cambridge). 52 (83), 12346-12349, (2016).
- Machado, I. et al. Rapid and specific detection of Salmonella infections using chemically modified nucleic acid probes. Analytica Chimica Acta. 1054 157-166, (2019).
- Sanders, E. R. Aseptic laboratory techniques: plating methods. Journal of Visualized Experiment. (63), e3064, (2012).
- Corporation, W. B., Diagnostics, W. Manual of Clinical Enzyme Measurements. Worthington Diagnostics, (1972).
- Burghardt, E. L. et al. Rapid, Culture-Free Detection of Staphylococcus aureus Bacteremia. PLoS One. 11 (6), e0157234, (2016).
- Bibette, J. Gaining confidence in high-throughput screening. Proceedings of the National Academy of Science U. S. A. 109 (3), 649-650, (2012).
- Hernandez, L. I., Machado, I., Schafer, T., Hernandez, F. J. Aptamers overview: selection, features and applications. Current Topics in Medicinal Chemistry. 15 (12), 1066-1081 (2015).
- Pande, J., Szewczyk, M. M., Grover, A. K. Phage display: concept, innovations, applications and future. Biotechnology Advances. 28 (6), 849-858, (2010).
- Skerra, A. Alternative binding proteins: anticalins – harnessing the structural plasticity of the lipocalin ligand pocket to engineer novel binding activities. FEBS Journal. 275 (11), 2677-2683, (2008).
- Ku, T. H. et al. Nucleic Acid Aptamers: An Emerging Tool for Biotechnology and Biomedical Sensing. Sensors (Basel). 15 (7), 16281-16313, (2015).
- Jayasena, S. D. Aptamers: an emerging class of molecules that rival antibodies in diagnostics. Clinical Chemistry. 45 (9), 1628-1650 (1999).
- Gray, B. P., Brown, K. C. Combinatorial peptide libraries: mining for cell-binding peptides. Chemical Reviews. 114 (2), 1020-1081, (2014).
Tags
30-Day free trial
- Full length videos
- Stream videos on TV, web, and mobile
- Add videos into playlist or course
- Embed videos into third party apps
- Access to video usage statistics
Balian, A., Garcia Gonzalez, J., Bastida, N., Akhtar, K. K., Borsa, B. A., Hernandez, F. J. Kinetic Screening of Nuclease Activity using Nucleic Acid Probes. J. Vis. Exp. (153), e60005, doi:10.3791/60005 (2019).
